Taking Stock of Carbon Footprints: A Visual Journey
/President Obama, on June 25th, laying out America’s climate policy for the future said: “So the question now is whether we will have the courage to act before it’s too late. And how we answer will have a profound impact on the world that we leave behind not just to you, but to your children and to your grandchildren. As a President, as a father, and as an American, I’m here to say we need to act.”
This post is about taking stock of carbon footprint of things big and small – countries, cities, industrial sectors, firms, products, and supply chains. Through an interactive visual, you can get a sense of carbon footprints of things big or small.
Enjoy!
Since the 1750s, atmospheric concentrations of carbon dioxide have risen from about 280 parts per million and recently crossed the 400 parts per million (ppm) barrier. Green House Gas (GHG) emissions have led to a 0.6 degree Celsius increase in the global average surface temperature since 1900. If the current trends in emissions continue, the Intergovernmental Panel on Climate Change (IPCC) estimates that global temperatures will rise a further 1.4 degrees to 5.8 degrees Celsius by 2100. Scientists agree that such increases will have disastrous effects - disrupting ecosystems (about 30% of plant and animal species will face extinction); increasing and intensifying environmental and climate disasters; endangering the world’s food supply; and causing widespread health issues. The consequences will negatively impact a large portion of the world’s population, especially in impoverished countries.
Yes, it is time to act.
There is widespread agreement today to keep the global average temperature from increasing by more than two degrees Celsius above pre-industrial levels. Scientists estimate that total emissions going forward should not exceed 565 billion tons by mid-century. The total GHG emissions in 2012 were in the order of 31.6 billion tons, and trends indicate that global emissions are increasing by about three percent every year. At this rate, it will take just over 15 years to hit the 565 billion ton number. Reversing this alarming trend will involve concerted carbon management efforts at all levels – countries, cities, local governments, corporations and individuals. My intent is to give you a visual journey of the carbon footprints of various entities – from countries and cities to products and their component parts. Following the adage of “what gets measured gets managed,” carbon footprints can help identify hotspots where action can be taken to mitigate emissions.
Footprint of Countries and Cities
A “carbon footprint” of an entity – a country, city, event, firm, product or service - is the total amount of greenhouse gas emissions (GHG) it produces. Greenhouse gases other than carbon dioxide (CO2), such as methane, nitrous oxide, sulfur hexafluoride and others are converted to their “CO2 equivalent” (CO2e) weight so that a single number can represent the environmental impact of the product.
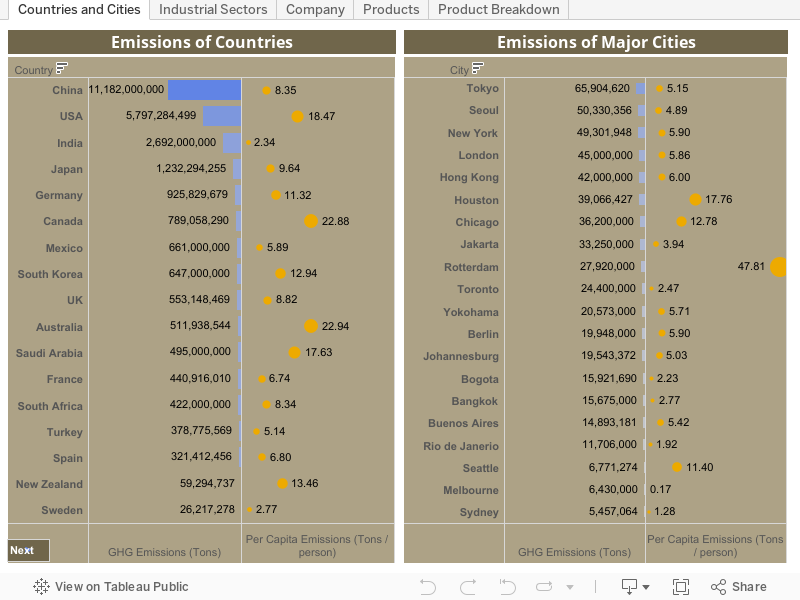
The accompanying visual (see the “Countries & Cites” tab) shows the footprint of the 20 largest GHG emitting countries in 2012. The Kyoto protocol, signed in 1990 under the “common but differentiated responsibility” principle, set binding targets for 37 industrialized countries (also called “Annex I”) for reducing GHG emissions by the end of 2012. The United States did not ratify the Kyoto protocol. China, India and Brazil - as developing economies - were exempt from emission reduction targets. Attempts to extend the Kyoto treaty beyond 2012 have thus far failed. However, in 2009, the Copenhagen Accord endorsed “the scientific view that the increase in global temperature should be below two degrees Celsius” and that Annex I countries will “commit to economy-wide emissions targets for 2020.” The Accord also recognized that developing nations would have to “implement mitigation actions,” report their emissions and subject these to verification.
Although not legally binding, several countries have proposed reduction targets in connection with the Copenhagen Accord. Compared to 1990 levels, the EU has proposed a target reduction of 20-30%, Japan by 25%, and Russia by 15-25%. President Obama’s plan proposes a 17% cut by 2020 compared to 2005 levels. China has proposed a cut of 40-45%; and India a cut of 20-25% on emission intensity (GHG per unit of GDP) by 2020 compared to 2005 levels. China and India’s measures do not ensure a reduction in absolute emissions – only that emissions will grow slower than GDP growth.
Cities, as the hub of social and economic activity, are both significant contributors of GHG emissions and highly vulnerable to climate change. City governments oversee infrastructure, host and promote businesses and provide services for their citizens.
Cities have a major role to play in GHG mitigation. First, city governments and services can have a substantial carbon footprint. For example, New York City government operations account for 3.47 million metric tons of CO2e annually. Tokyo’s city government emissions are 2.06 million metric tons annually. Using renewable energy, expanding and improving the efficiency of public transport, retrofitting public buildings and street lighting, managing waste streams and increasing green spaces all reduce the footprint and enable a better quality of life. Second, cities have a significant impact on how their citizens live and how corporations conduct business. Engaging citizens and businesses through incentives and joint partnerships will galvanize cities to become climate neutral. Portland and Seattle (US), Toronto (Canada) and Yokohama (Japan) have targeted an 80% decrease in CO2e emissions by 2050 over 1990 levels. Rotterdam (Netherlands) has pledged a cut in emissions by 50% and London (UK) has proposed a cut of 60% in emissions by 2025 over 1990 levels.
more after the graphic...
Industrial sector, Firm, and Product Footprints
Businesses are responsible for 20-25% of the world’s GHG emissions. Their emissions are a result of their production processes and facilities, the resources they consume, extraction and processing of relevant raw materials in supplier operations and the impact of their product or service on their customers.
Firms are increasingly accessing the risk and opportunities of climate change and integrating it into the overall business strategy. In the latest survey by the non-profit Carbon Disclosure Project of the top 500 global firms, 48% said that they integrate risks and opportunities of climate change into their planning and 65% of them indicated that they had GHG emission mitigation targets. The major reasons for reducing GHG emissions include the increased ability to market new low-carbon products, compliance to existing and anticipated laws, and to increase efficiency while reducing disruptions in the supply chain.
There are multiple standards available to companies for accounting their GHG emissions. The Greenhouse Gas Protocol (GHG Protocol), developed in partnership with the World Resources Institute (WRI) and the World Business Council for Sustainable Development (WBCSD), is the most widely used standard. It provides businesses a consistent, and verifiable way to account for their GHG emissions. The GHG Protocol specifies three types of emissions called “scopes.” Scope 1 emissions are a result of all company operations – production processes, waste streams, facilities, and employees. Scope 2 is emissions from purchased electricity, and Scope 3 is emissions associated with the supply chain. This includes related emissions from suppliers who handle product components; and the emissions from downstream distribution, use, and end-of-life management of the product/service.
The scope information gives an insight into appropriate strategies to reduce emissions. Scope 3, not surprisingly, for the Energy sector (see the “Industrial Sectors” tab) is almost an order of magnitude larger than the sum of scope 1 and scope 2. While Oil & Gas exploration, drilling, refining, transportation, and storage are responsible for large GHG emissions, the use of oil & gas by other industrial sectors, residences, automobiles, trains, and planes are responsible for most of the emissions in this sector. The solution to reduce emissions in this industry is obviously complex – a national energy policy (President Obama’s policy will move away from coal towards natural gas and this will no doubt help reduce GHGs), fuel efficiency standards, urban planning and transportation all have important roles to play in addition to the firms in the sector.
Firm Snapshot: Apple Inc.
Apple Inc. designs, manufactures and sells a wide range of electronic devices, software, services, and third-party digital content and applications via its retail, iTunes, and App stores.
To manufacture its electronics devices, Apple sources components from all over the world, subcontracts production and assembly primarily in Asia, and sells in its own retail outlets in addition to several over distribution channels (See my post on the Apple iPhone 4 Supply Chain). The “Company” tab shows the scope 1, 2, and 3 breakdown for Apple. Scope1 and 2 are primarily from its facilities. Scope 3 emissions, meanwhile, is more than 50 times the sum of the scope 1 and 2 combined. This includes among others, the emissions from supplier operations, production, transportation, product use, and recycling. The two biggest sources of emissions are production and product use.
Apple’s GHG reductions in production includes reducing material use in devices and in packaging, elimination of certain hazardous materials, and designing the product with appropriate materials such as Aluminum and glass so they can be recycled at end of life. The design also involves energy efficient components and it’s monitoring via software so the emissions during product use are reduced. Apple has increased its reliance on renewable energy by 200% since 2005 and is using 100% renewable energy in its Elk Grove, Cork, and Austin facilities, reducing its Scope 1 & 2 emissions.
The CO2e emissions of a product or service include activities throughout its life cycle, right from extraction and processing of raw materials, production and use to end-of-life. The “Products” tabs shows the CO2e of some common products and services.
The standard process to compute the footprint of a product is to map the supply chain, identify key activities in the product life cycle and compute emissions. This analysis will identify carbon “hotspots” in the supply chain so that appropriate actions can be taken to reduce emissions in those activities. The iPhone5 for example (see the “Product breakdown” tab) 76% of the 75 kg of CO2e emissions are from its production, 18% from customer use; 4% from transportation, and 2% from recycling. No surprise that production is such a large part – Apple’s complex and global network of suppliers and assemblers contribute to it. To reduce the impact will take product redesign, engaging suppliers and customers, increasing efficiencies of processes, use of renewable energy and reclaiming products after use to create raw material.
Final Thoughts
The IPCC reports that to stabilize carbon dioxide levels between 445 and 490 ppm, emissions would need to peak around 2015, along with a 50% to 85% reduction on 2000 levels by 2050. While the current trajectory of public policy and organizational response to sustainable development is encouraging, it falls well short of the reductions recommended to maintain CO2 concentrations in the 445-490 ppm range, leaving much of humankind susceptible to the risks of climate change. Hopefully, we, as nations, local and city governments, companies and consumers of products and services, can redouble our efforts to significantly reduce our footprints. This effort needs to be focused on how we generate and use energy, increase the efficiency - both ecological and economic – of our industrial and agricultural processes, and finally, how we “close the loop” or conserve and reuse natural resources in supply chains.
Yes, it is time to act.
Malcolm Hegeman contributed to this post and to the development of the visual.
Notes:
1. This post is an excerpt from my book: Sustainable Supply Chains (Springer)
2. Data Sources:
a) GHG total for countries and per-capita emissions: Climate Analysis Indicators Tool (CAIT) Version 8.0. (Washington, DC: World Resources Institute, 2011). Can be freely downloaded from: CAIT
b) Cities emission data is available from the Carbon Disclosure Project: CDP Cities
c) Data for the footprints of industrial sectors were collated from the Carbon Disclosure Project: CDP Investor Program
d) Product and supply chain data are self-reported by those companies. Details are available from me.